Mark @ Mozilla

Performance team

Scheduling Telemetry Analysis

In a previous post, I described how to run an ad-hoc analysis on the Telemetry data. There is often a need to re-run an analysis on an ongoing basis, whether it be for powering dashboards or just to see how the data changes over time.

We’ve rolled out a new version of the Self-Serve Telemetry Data Analysis Dashboard with an improved interface and some new features.

Now you can schedule analysis jobs to run on a daily, weekly, or monthly basis and publish results to a public-facing Amazon S3 bucket.

Typical Scheduling

Here’s how I expect that the analysis-scheduling capability will normally be used:

  1. Log in to telemetry-dash.mozilla.org
  2. Launch an analysis worker in the cloud
  3. Develop and test your analysis code
  4. Create a wrapper script to:
    • Do any required setup (install python packages, etc)
    • Run the analysis
    • Put output files in a given directory relative to the script itself
  5. Download and save your code from the worker instance
  6. Create a tarball containing all the required code
  7. Test your wrapper script:
    • Launch a fresh analysis worker
    • Run your wrapper script
    • Verify output looks good
  8. Head back to the analysis dashboard, and schedule your analysis to run as needed

Dissecting the “Schedule a Job” form

  • Job Name is a unique identifier for your job. It should be a short, descriptive string. Think “what would I call this job in a code repo or hostname?” For example, the job that runs the data export for the SlowSQL dashboard is called slowsql. You can add your username to create a unique job name if you like (ie. mreid-slowsql).
  • Code Tarball is the archive containing all the files needed to run your analysis. The machine on which the job runs is a bare-bones Ubuntu machine with a few common dependencies installed (git, xz-utils, etc), and it is up to your code to install anything extra that might be needed.
  • Execution Commandline is what will be invoked on the launched server. It is the entry point to your job. You can specify an arbitrary Bash command.
  • Output Directory is the location of results to be published to S3. Again, these results will be publicly visible.
  • Schedule Frequency is how often the job will run.
  • Day of Week for jobs running with daily frequency.
  • Day of Month for jobs running with monthly frequency.
  • Time of Day (UTC) is when the job will run. Due to the distributed nature of the Telemetry data processing pipeline, there may be some delay before the previous day’s data is fully available. So if your job is processing data from “yesterday”, I recommend using the default vaulue of Noon UTC.
  • Job Timeout is the failsafe for jobs that don’t terminate on their own. If the job does not complete within the specified number of minutes, it will be forcibly terminated. This avoids having stalled jobs run forever (racking up our AWS bill the whole time).

Example: SlowSQL

A concrete example of an analysis job that runs using the same framework is the SlowSQL export. The package.sh script creates the code tarball for this job, and the run.sh script actually runs the analysis on a daily basis.

In order to schedule the SlowSQL job using the above form, first I would run package.sh to create the code tarball, then I would fill the form as follows:

  • Job Name: slowsql
  • Code Tarball: select slowsql-0.3.tar.gz
  • Execution Commandline: ./run.sh
  • Output Directory: output – this directory is created in run.sh and data is moved here after the job finishes
  • Schedule Frequency: Daily
  • Day of Week: leave as default
  • Day of Month: leave as default
  • Time of Day (UTC): leave as default
  • Job Timeout: 175 – typical runs during development took around 2 hours, so we wait just under 3 hours

The daily data files are then published in S3 and can be used from the Telemetry SlowSQL Dashboard.

Beyond Typical Scheduling

The job runner doesn’t care if your code uses the python MapReduce framework or your own hand-tuned assembly code. It is just a generalized way to launch a machine to do some processing on a scheduled basis.

So you’re free to implement your analysis using whatever tools best suit the job at hand.

The sky is the limit, as long as the code can be packaged up as a tarball and executed on a Ubuntu box.

The pseudo-code for the general job logic is

1
2
3
4
5
fetch $code_tarball
tar xzvf $code_tarball
`$execution_commandline`
cd $output_directory
publish --recursive ./ s3://public/$job_name/data/

Published Output

One final reminder: Keep in mind that the results of the analysis will be made publicly available on Amazon S3, so be absolutely sure that the output from your job does not include any sensitive data.

Aggregates of the raw data are fine, but it is very important not to output the raw data.
Recent Telemetry Data Outages

There have been a few data outages in Telemetry recently, so I figured some followup and explanation are in order.

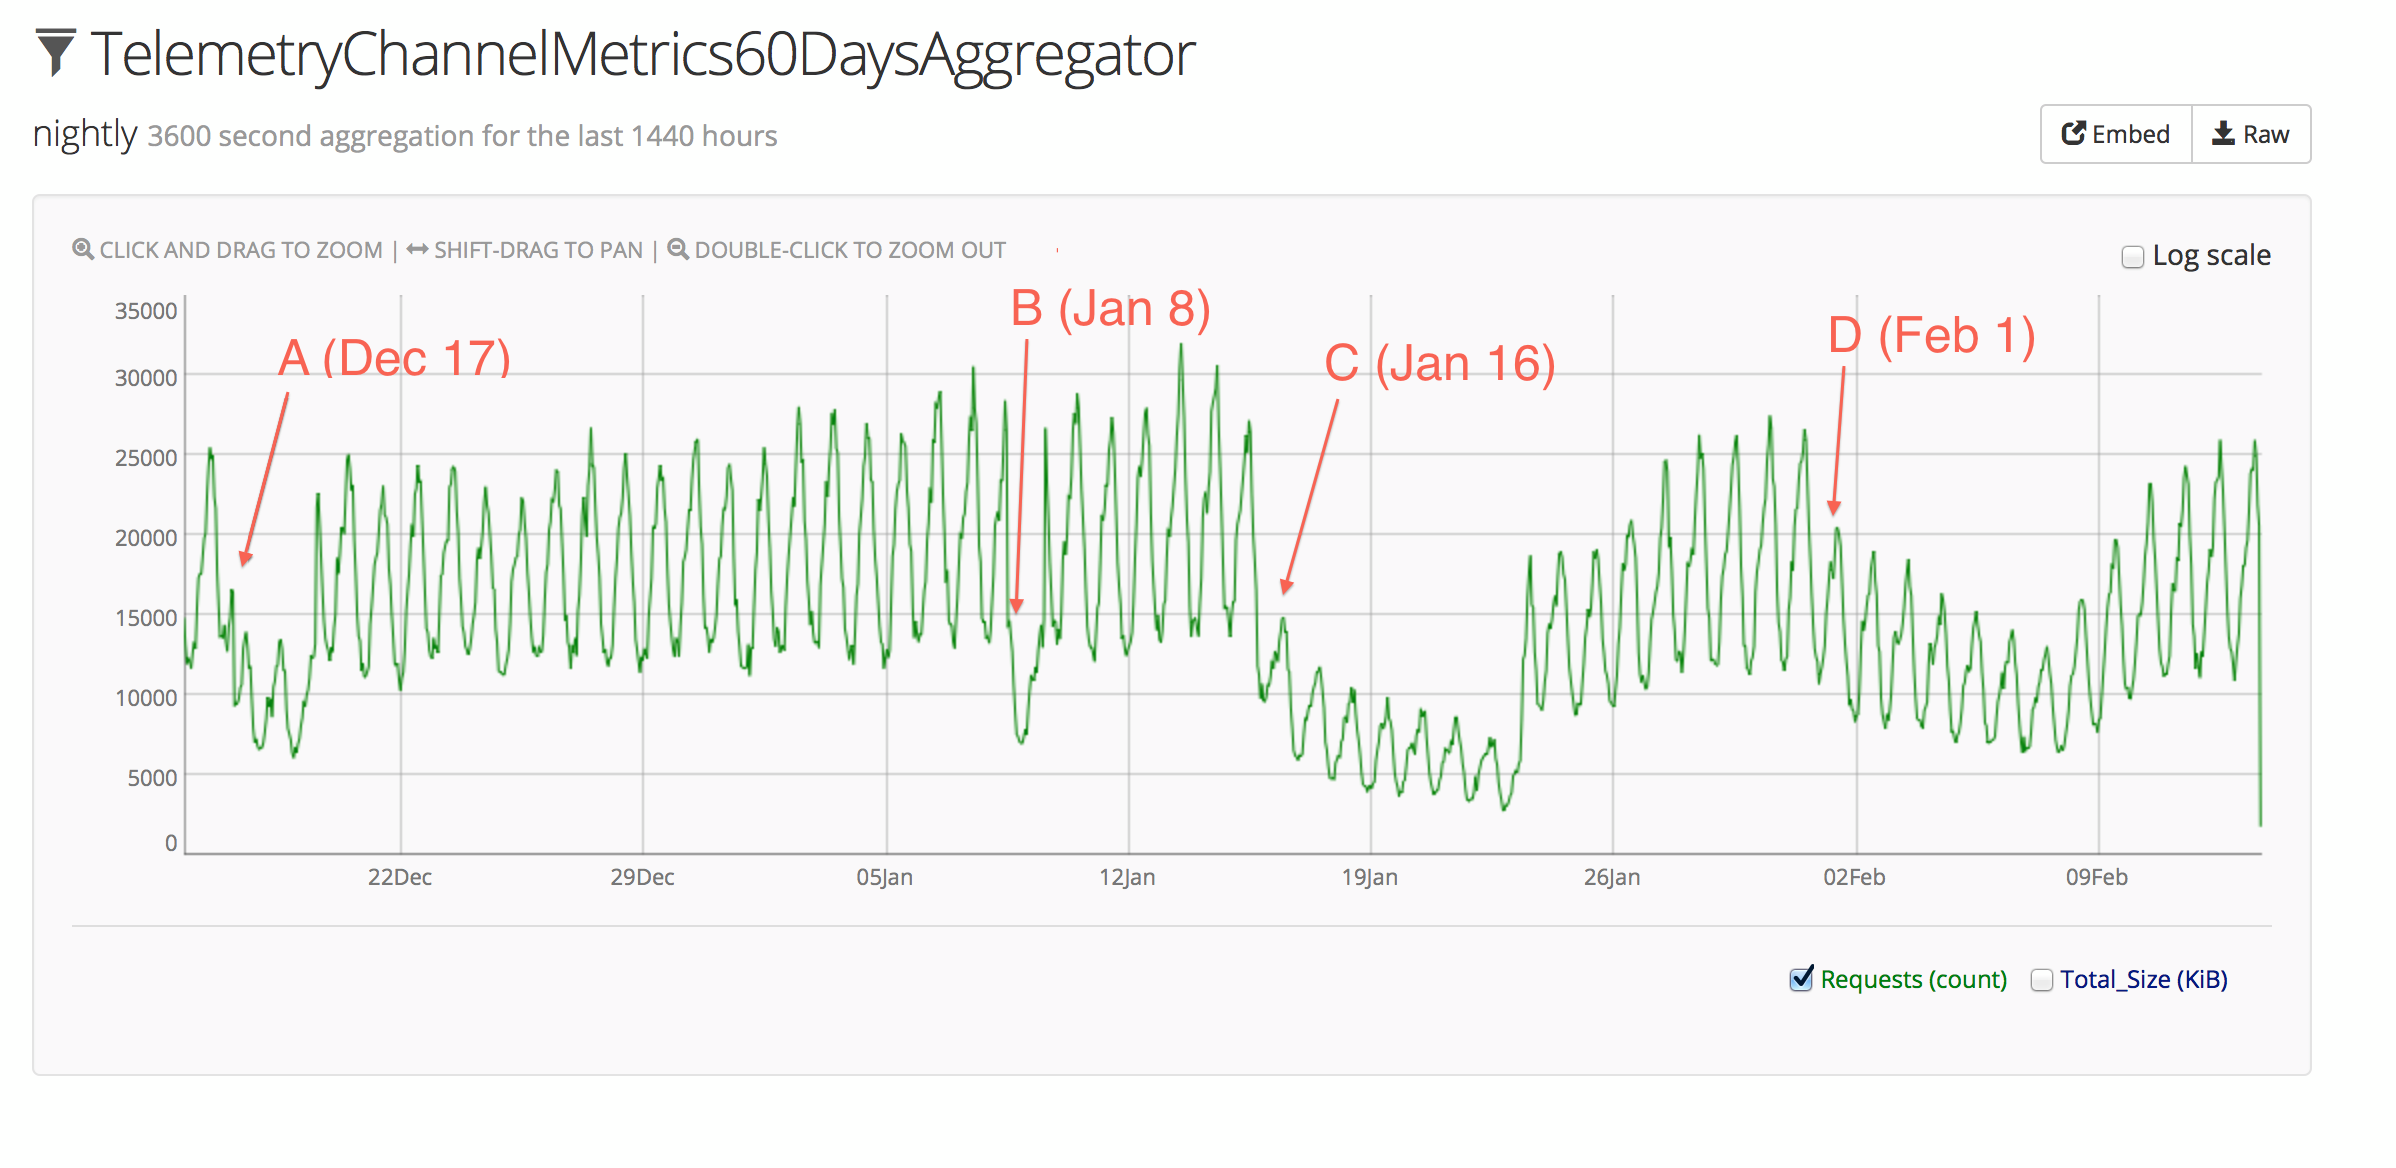
Here’s a graph of the submission rate from the nightly channel (where most of the action has taken place) over the past 60 days:

Heka Graph of nightly submissions for the past 60 days

The x-axis is time, and the y-axis is the number of submissions per hour.

Points A (December 17) and B (January 8) are false alarms, and were just cases where the stats logging itself got interrupted, and so don’t represent data outages.

Point C (January 16) is where it starts to get interesting. In that case, Firefox nightly builds stopped submitting Telemetry data due to a change in event handling when the Telemetry client-side code was moved from a .js file to a .jsm module. The resolution is described in Bug 962153. This outage resulted in missing data for nightly builds from January 16th through to January 22nd.

As shown on the above graph, the submission rate dropped noticeably, but not anywhere close to zero. This is because not everyone on the nightly channel updates to the latest nightly as soon as it’s available, so an interesting side-effect of this bug is that we can see a glimpse of the rate at which nightly users update to new builds. In short, it looks like a large portion of users update right away, with a long tail of users waiting several days to update. The effect is apparent again as the submission rate recovers starting on January 22nd.

The second problem with submissions came at point D (February 1) as a result of changing the client Telemetry code to use OS.File for saving submissions to disk on shutdown. This resulted in a more gradual decrease in submissions, since the “saved-session” submissions were missing, but “idle-daily” submissions were still being sent. This outage resulted in partial data loss for nightly builds from February 1st through to February 7th.

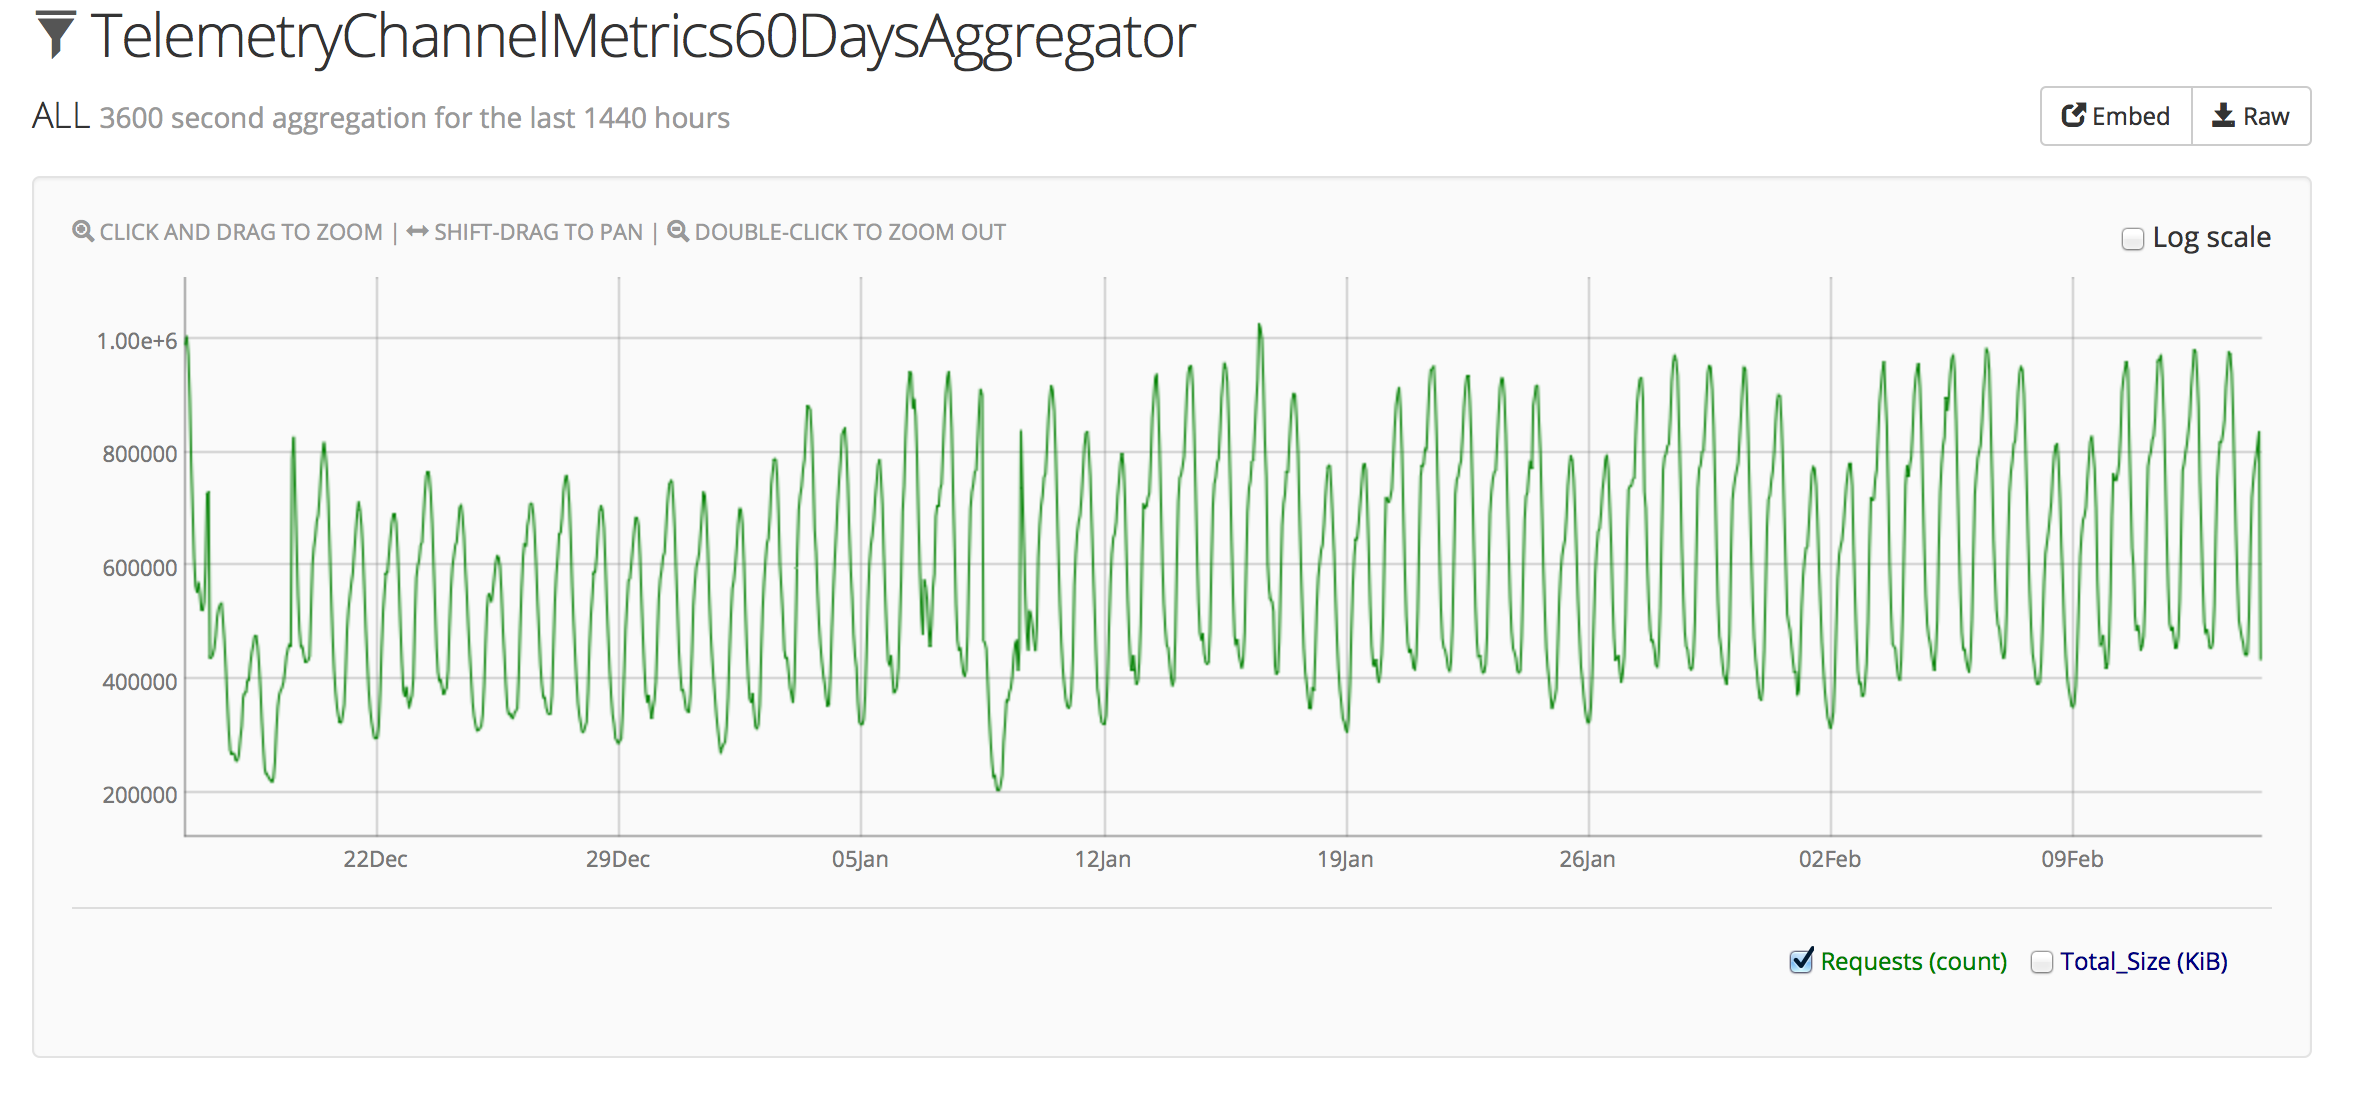
Both of these problems have been limited to the nightly channel, so the actual volume of submissions that were lost is relatively low. In fact, if you compare the above graph to the graph for all channels:

Heka Graph of all submissions for the past 60 days

The anomalies on January 16th and February 1st are not even noticeable within the usual weekly pattern of overall Telemetry submissions (we normally observe a sort of “double peak” each day, with weekends showing about 15-20% fewer submissions). This makes sense given that the release channel comprises the vast majority of submissions.

The above graphs are all screenshots of our Heka aggregator instance. You can look at a live view of the submission stats and explore for yourself. Follow the links at the top of the iframes to dig further into what’s available.

There was a third data outage recently, but it cropped up in the server’s data validation / conversion processing so it doesn’t appear as an anomaly on the submission graphs. On February 4th, the revision field for many submissions started being rejected as invalid. The server code was expecting a revision URL of the form http://hg.mozilla.org/..., but was getting URLs starting with https://... and thus rejecting them. Since revision is required in order to determine the correct version of Histograms.json to use for validating the rest of the payload, these submissions were simply discarded. The change from http to https came from a mostly-unrelated change to the Firefox build infrastructure. This outage affected both nightly and aurora, and caused the loss of submissions from builds between February 4th and when the server-side fix landed on Februrary 12th.


So with all these outages happening so close together, what are we doing to fix it?

Going forward, we would like to be able to completely avoid problems like the overly-eager rejection of payloads during validation, and in cases where we can’t avoid problems, we want to detect and fix them as early as possible.

In the specific case of the revision field, we are adding a test that will fail if the URL prefix changes.

In the case where the submission rate drops, we are adding automatic email notifications which will allow us to act quickly to fix the problem. The basic functionality is already in place thanks to Mike Trinkala, though the anomaly detection algorithm needs some tweaking to trigger on things like a gradual decline in submissions over time.

Similarly, if the “invalid submission” rate goes up in the server’s validation process, we want to add automatic alerts there as well.

With these improvements in place, we should see far fewer data outages in Q2 and beyond.

Last minute update

While poking around at various graphs to document this post, I noticed that Bug 967203 was still affecting aurora, so the fix has been uplifted.

Current State of Telemetry Analysis

Update 2014-11-19: a few papercuts have been fixed, and data location has changed, so the instructions below have been updated since the original post from 2013.

The Telemetry Server has been deployed on AWS for just over a month now, so it’s time for an update.

The server code repository has been moved into the Mozilla github group, and the mreid-moz repo forwards there, so the change should be seamless.

The Telemetry dashboards have also moved! They are now located at telemetry.mozilla.org, nice and easy to remember.

Moving on to more interesting news, anyone with an @mozilla.com email can now run their own Telemetry analysis jobs in the cloud. The procedure is still very much in alpha/beta state, but if you’ve got a question that can be answered using Telemetry data, you’re in luck.

Jonas has built a mechanism for provisioning a ubuntu server as an Amazon EC2 instance. These machines (c3.4xlarge in EC2 terms) have read-only permission and a fast connection to Telemetry data stored in S3. Each machine will be available for 24 hours, and will cost about $40USD to run. If you don’t need it for the full day, you can kill it early by following the instructions in the webapp below.

Here’s how it works:

  • Visit the analysis provisioning dashboard at telemetry-dash.mozilla.org and sign in using Persona (with an @mozilla.com email address as mentioned above).
  • Enter some details. The Server Name field should be a short descriptive name, something like ‘mreid chromehangs analysis’ is good. Upload your SSH public key (this allows you to log in to the server once it’s started up)
  • Click Submit.
  • A Ubuntu machine will be started up on Amazon’s EC2 infrastructure. Once it has started up, you can SSH in and run your analysis job. Reload the webpage after a couple of minutes to get the full SSH command you’ll use to log in.
  • Make sure to download your results when you’re finished! Your analysis machine will automatically get killed after 24 hours.

Ok, that’s all well and good, but what is an analysis job?

The easiest (and probably most familiar to anyone who has worked with Telemetry data in the past) is to run a MapReduce job.

This requires a bit of setup on the machine you provisioned above:

  • Set up some working directories:
1
$ mkdir -p /mnt/telemetry/work
  • Create an input filter to match the data you want. Look at the examples at mapreduce/examples/*.json. Here is a reasonably selective one.
  • Create a new analysis script, or run one of the example ones:
1
2
3
4
5
6
7
8
9
$ cd ~/telemetry-server
$ python -m mapreduce.job mapreduce/examples/osdistribution.py \
   --input-filter /path/to/filter.json \
   --num-mappers 16 \
   --num-reducers 4 \
   --data-dir /mnt/telemetry/work \
   --work-dir /mnt/telemetry/work \
   --output /mnt/telemetry/my_mapreduce_results.out \
   --bucket "telemetry-published-v2"

A few notes for successful jobs.

  • Try to keep the amount of data you’re crunching to a minimum while you’re developing your job. It’ll save time, and prevent the system from running out of memory. A good start is to process just a single day’s nightly data.
  • If you do run out of memory, try increasing the number of mappers and reducers.
  • After the first run, you can point the “—data-dir” argument at <work-dir>/cache and add the “—local-only” parameter to skip downloading files from S3 every time
  • Give us a heads-up in #telemetry and we’ll tell you about any other caveats.

One final note – the Telemetry MapReduce framework is a simple way to download the set of records you are interested in, and do something for each record in that data set.

If you don’t want to do your analysis with this framework, you can just use it to download the data (or even skip it altogether and download data using the AWS command-line tools directly). Once the data has been downloaded to the machine, you’re free to analyze it using whatever other language / tools you’re comfortable with.

Happy Data Crunching!

Deploying the Next Telemetry Server

Yesterday was our target for cutting over to the “rebooted” telemetry server. Despite some last-minute travel (I spent Monday en route from Nova Scotia to San Francisco), I’m happy to report that the switch went rather smoothly on Tuesday! More details on the required changes can be found in Bug 921161.

Since my last update, there have been a few last-minute code changes to get things in ship-shape for deployment. The bulk of those changes were to the scripts used to provision machines on Amazon’s EC2 infrastructure, but there was one more structural change of note.

The logic for processing incoming submissions (that’s the “validation, conversion, and compression” part) was previously controlled by a master process which would launch a worker node to do the actual processing. Without an easy way for masters to co-ordinate, it was difficult to launch extra workers in cases where the rate of processing was not keeping up, since each master expected its worker to process all available data.

The solution was to switch to using a queue to keep track of data available to be processed, and having the worker nodes claim data from the queue. This results in a nicely decoupled architecture, where starting up more workers (or killing off idle ones) is clean and easy.

Anyways, getting back to the main point… The cutover is complete, and the Telemetry submissions are now going to “The Cloud!”

It turns out that the node.js version of the web server is efficient enough to allow us to handle the entire volume of traffic using only a pair of “t1.micro” nodes in EC2 (behind a load balancer). Pretty slick.

So far, running on AWS has been pretty nice. The Elastic Load Balancers make it nearly-trivial to add or remove nodes from the pool, and include useful (if limited) monitoring. On the HTTP-serving nodes themselves, we have some more detailed and application-specific monitoring using Heka. The boto library makes it very easy to provision new nodes using python.

Now that the Telemetry Server is out in the wild, the next step is to get the new Dashboard playing nicely with the new data source. Jonas Finnemann Jensen is working on that.

There’s still more work to do once the dashboard integration is complete, including finishing up the C++ port of the “process incoming” code (which will hopefully provide a large speedup compared to the current python implementation), migrating the provisioning over to Amazon Cloud Formation, creating a frontend for managing/running Telemetry MapReduce jobs, and exporting the historic data from the previous Hadoop backend into the new S3 storage.

The Final Countdown

Release day is rapidly approaching. We’re targeting October 1st for the release of the first version of the telemetry reboot. Only two weeks left – exciting times!

There’s now a tracking bug that should list everything that needs to be done before things go live: Bug 911300.

The code has changed a fair bit since my last update, the most noticeable modification being that the HTTP server is now using node.js instead of a python+flask server.

Here is the basic architecture diagram for the system: Telemetry Data Flow diagram

Data flows into an incoming bucket, which can then be processed separately by one or more processing nodes, each of which publishes finalized data to a published bucket.

The MapReduce code then reads from the published location for data analysis.

Other changes include updating the “process incoming data” code to take advantage of multiple processors, though it appears that python performance is still a major bottleneck. Fortunately Mike Trinkala is working on porting the conversion code to C++.

Keep an eye on the bug above for up-to-the-minute progress information, or as always, feel free to drop by #telemetry on irc.mozilla.org.

Two Years In

I figured since I missed it last year, I should post something on my Mozillaversary!

I started on the Metrics team on August 8th, 2011, and more recently moved over to the Performance team. Lots of fun stuff to learn and do, and I’m happier than ever that I joined Mozilla.

Two orders of business in this post. First, another status update on the Telemetry Reboot project.

Things are basically feature-complete on the server now! Very exciting. The high-altitude view looks like this:

Data comes in as HTTPS submissions, and is saved to disk in its raw form. These files are converted to the new Histogram storage format, compressed, then sent to Amazon S3 for permanent storage.

You can run MapReduce jobs on the S3 data (though at the moment there’s a lot more time spent on data transfer than I would like). If you run a MapReduce job on the server node, you can also include up-to-the-minute data that has not yet been exported to S3.

Now that the prototype (which reminds me a bit of this description of the Hideous Creature Warning: strong language) is working, the next step is to benchmark things to make sure we can handle release-level volumes.

The second order of business is an interesting thing I learned about Python File I/O that I thought I’d share.

Normal file writes are not atomic, so if you have a situation where multiple concurrent processes are appending lines to the same file, it’s possible (and in fact very likely) to end up with garbled lines. The Telemetry storage format requires that each record be on its own line, so this caused real problems during testing.

The solution: use io.open(...).

For example, doing this will produce non-atomic writes:

1
2
3
fout = open(filename, "a")
fout.write(some_content)
fout.close()

So some_content could actually be written out in multiple disk operations, with other writes by other processes in between.

Instead, to achieve atomic writes, you would use something like this:

1
2
with io.open(filename, "a") as fout:
    fout.write(some_content)

Maybe this is common knowledge for Python folks, but I hope it helps.

Telemetry Server Progress

Just a quick post to update on progress with the Telemetry Server project.

First and foremost, the telemetry-server code is now on github.

As of Friday, there is a basic prototype server up and running on an Amazon EC2 instance.

The prototype is able to accept submissions via HTTP, using URLs without or with dimension components. Submissions are then converted to the new storage format and saved to disk in the new storage layout.

As part of the conversion process, the histograms in the payload are validated against the correct revision of Histograms.json. This file is automatically fetched from the Mozilla mercurial server, then cached locally. The RevisionCache class encapsulates this logic.

The prototype server in its current form is too monolithic, and needs to be split up such that receiving submissions via HTTP is independent from the remainder of the data pipeline.

The first part, recieving and logging HTTP submissions, is a well-understood problem and there are many existing ways so solve it. Some options are:

  • Use the existing Bagheera server, and consume messages from Kafka.
  • Make more direct use of one of the many message queues (such as Amazon SQS, RabbitMQ, or Kafka)
  • Write new code to save raw payloads to a temporary storage area using a similar layout to the long-term storage layout.

The second part is already in place and working, with code that should be quite easy to pull out and run separately. One additional piece of functionality that would be nice is to calculate realtime stats before/while data is being persisted.

Other than separating receiving and processing functionality, the next major task will be building a MapReduce framework to run on the Telemetry data. Initially, it will not be a full-blown cluster implementation, since reinventing that particular wheel is a huge task, but rather it will run on a single machine using multiple processes to parallelize map and reduce functionality.

One major advantage of the new storage layout is that MapReduce jobs will be able to filter the desired input data on a number of dimensions basically for free. Jobs that only need to look at a small subset of the data should be very efficient.

The first use case of the MapReduce framework is to produce the static data files for the new telemetry frontend.

A New Project

Over the coming weeks I’ll be embarking on a new project to revamp the acquisition, storage, and processing of Mozilla Telemetry data.

The general pipeline for Telemetry data looks like this:

  1. A Firefox user enables Telemetry in their browser
  2. The browser generates performance data as it is used
  3. Once a day, the browser submits the performance data to Mozilla via HTTPS
  4. Data is accepted by the server and saved to a queue
  5. The queue is polled for changes and payloads are saved to persistent storage
  6. Analysis jobs are run against the persisted data, including daily aggregations
  7. Results of analysis are visualized in Telemetry Dashboards

My initial focus will be on steps 5 and 6, specifically on improving the persistent storage format to be more space-efficient and to eliminate the need for re-processing to slice the data (by factors like Channel, Version, Day, etc).

I plan to post a link to the code repository here (as soon as there is something useful to share).